HorseGeneAnnotation Crowd sourcing the equine genome
FINDING EXONS- NCBI & BLAST
The goal of this tutorial is to get you comfortable with locating gene sequences and assessing their structure using NCBI and BLAST for manual annotation.
- Start by logging onto the NCBI Gene Website
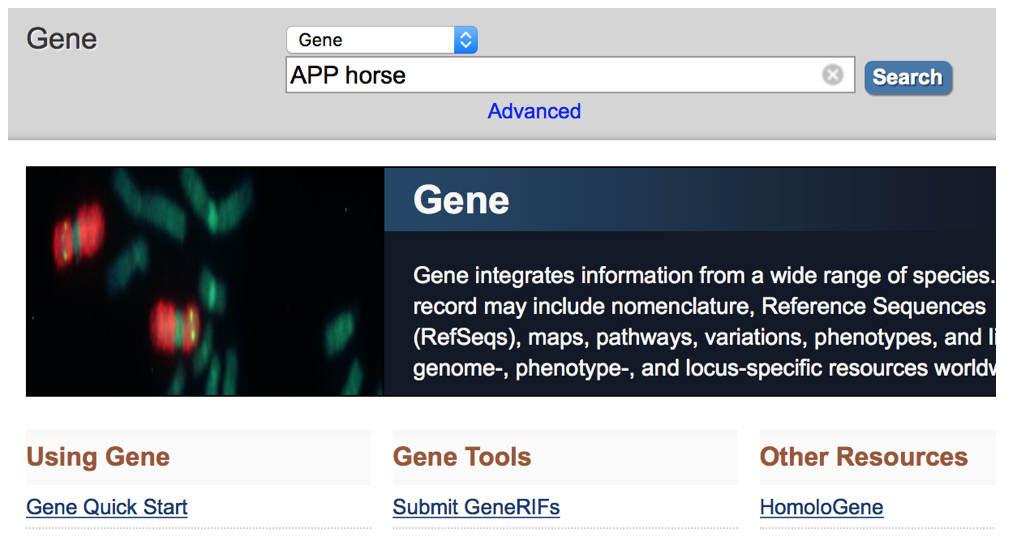
- Enter the gene name & the species (equus caballus or horse) and hit Search
- This pulls up the reference genome (EquCab 3.0) which is a whole genome sequence for one individual horse that we can use for comparison. Part of the process with manual annotation is determining if differences between the horse & human reference genomes indicate a real difference between the species, or are due to an error in the horse reference sequence. Many reference genomes of animal species have errors in assembly and annotation and we need to determine if the horse gene structure is correct before we can use it to determine if horses contain mutations that would affect the structure and function of the gene. And all individuals carry potentially deleterious mutations, such as premature stop codons, frameshifts, and missense mutations in highly conserved places; these don’t necessarily lead to clinical disease. We seek to determine if the denoted exons and structure of the genes in the horse reference is accurate and where it likely needs correction or further work.
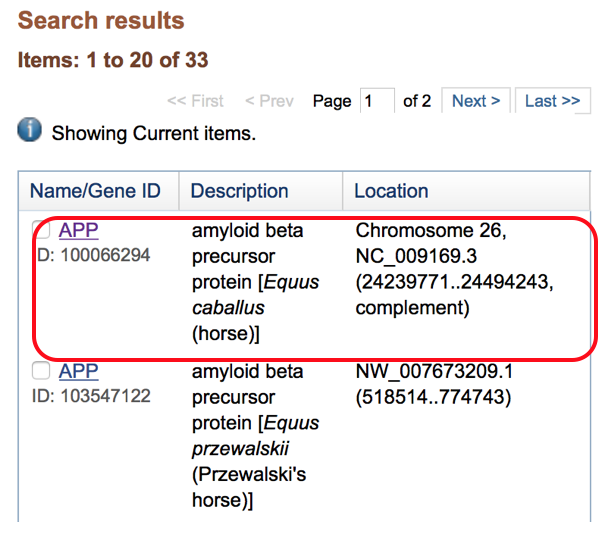
- Select the equine Gene from the search result list:
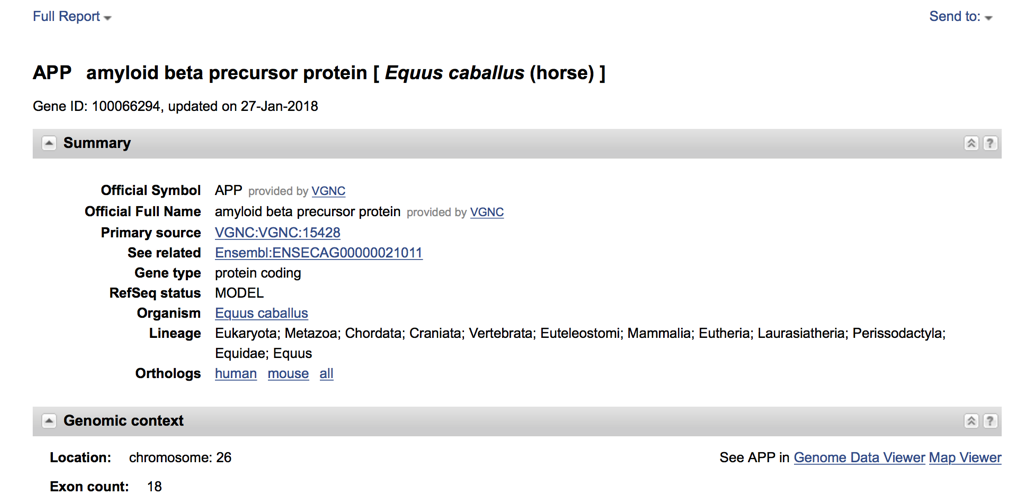
- Information is available on this screen including the gene ID, description, location and position (Chr 26: 24,239,771-24,494,243).
- Once the gene is selected a lot more information can be obtained including the description of the gene, gene type, location and exon count. Continuing further down on on this page will show diagrams of the gene, exons etc.
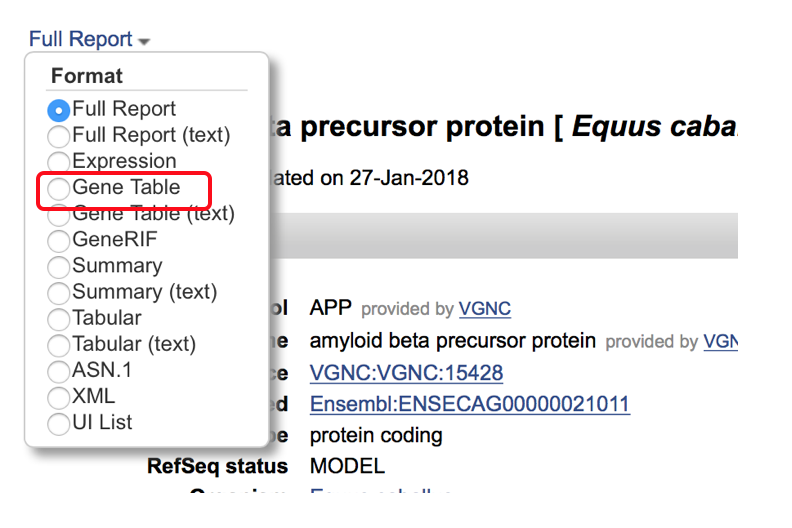
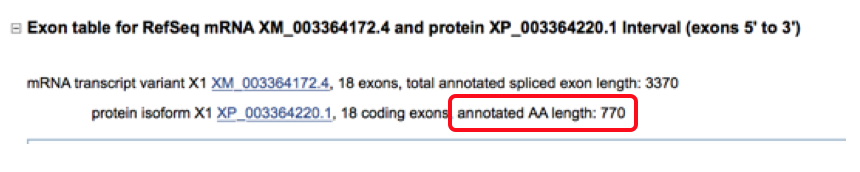
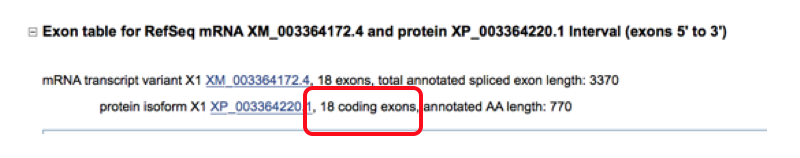
- Begin by selecting the “Full Report” drop down in the upper left corner and change the format to “Gene Table”. This will bring up a screen with the available transcripts and exons/coding sequence for review.
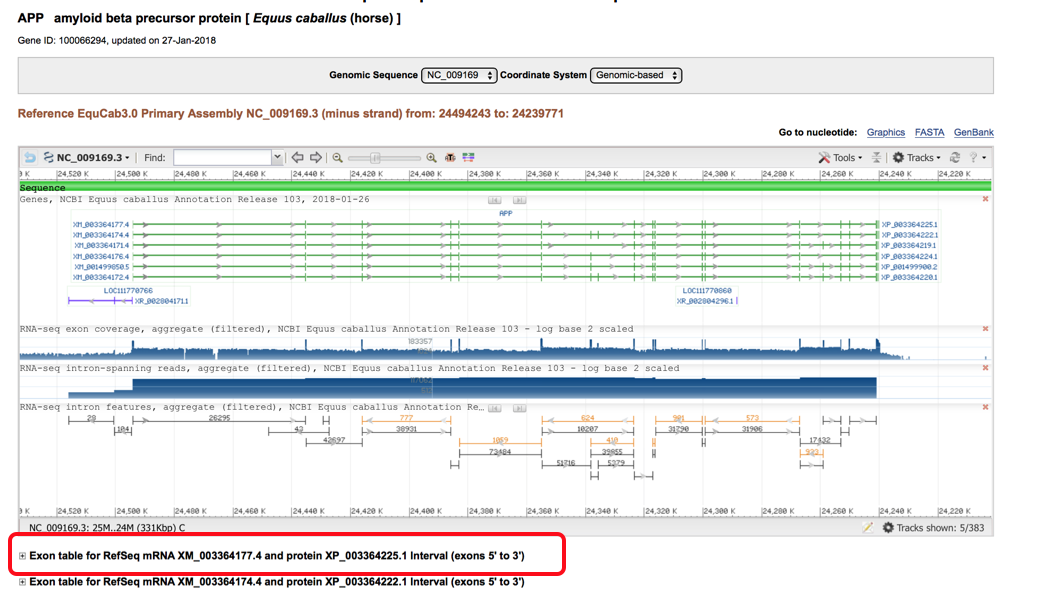
- The “Gene Table” screen looks like the following with the diagram above the available transcripts (highlighted in red box. Selection of the plus sign to the left of the transcripts will open up more information about the available transcripts including exon length, coding sequence, introns and number of amino acids.
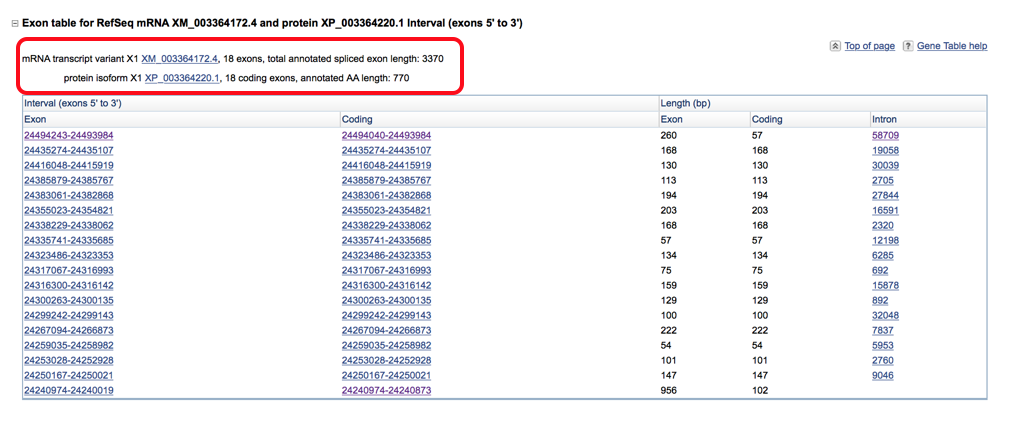
- Below is an example of a transcript that has been selected. The transcript screen shows the number of exons, total annotated exon length and the annotated AA length. It is helpful to start by looking through all of the available transcripts for the horse genome (by clicking on all the plus signs) and selecting the largest transcript (by annotated AA length and number of coding exons) to begin with. Then compare this equine transcript to the available human transcripts (there are normally more human transcripts available) and pick the human transcript that is the best match to the equine. There may be times where they don’t match perfectly and then you should pick the largest human transcript available.
-
Once you have the largest horse transcript and the human transcript that best matches it selected, you can move on to comparing the gene annotation between the two species. The exon table is sorted into five columns that read Exon, Coding, Length (Exon), Length (Coding), and Intron. The Exon and coding sequence columns will pull up the base pair sequence and correspond to the base pair lengths in column 3 (exon) & 4 (coding). The intron column will pull up the intron base pair sequence.
-
This is what the individual coding sequence of the exon will look like with the base pair position located on the right of the screen.
- Comparison of transcripts begins by looking at the number of the exons and associated base pair length. It is important to ask yourself these questions as you are going through the comparison phase as it will drive the rest of the process. A descriptive of how to find the answers to these questions is detailed below.
- Do the horse & human genome have same number of amino acids?
- Do the horse and human have the same number of exons?
- Are the exons the same length? Compare the exons and base pair lengths between both horse & human genomes.
- Is there a 5’ and 3’ untranslated region?
- Is there a start codon (ATG)?
- Are the splice junctions appropriate? Do all intron regions begin with GT and end with AG?
- Is there a stop codon (TAG, TAA, TGA)?
- Are there n’s in the sequence?
- Do the horse & human genome have the same number of amino acids? This is located in the transcript description.
- Do the horse & human have the same number of exons? This can also be found on the transcript screen.
- Are the exons the same length? Compare the base pair length of the human and horse genomes by looking at the coding length column. The total exon length (column 3) includes the untranslated regions which can make it longer than the coding length (especially the first few and last few exons as this is where the 5’ and 3’ UTR would be located).
- For example in the picture below the first exon has an exon length of 260 base pairs and a coding length of 57 indicating that the first 203 base pairs of that exon is the 5’ UTR and the last 57 of the exon are the coding sequence. The last exon has an exon length of 956 and coding length of 102 indicating the first 102 base pairs of that exon are the coding sequence which terminates in a stop codon and then 854 base pairs of the 3’ UTR are also included.
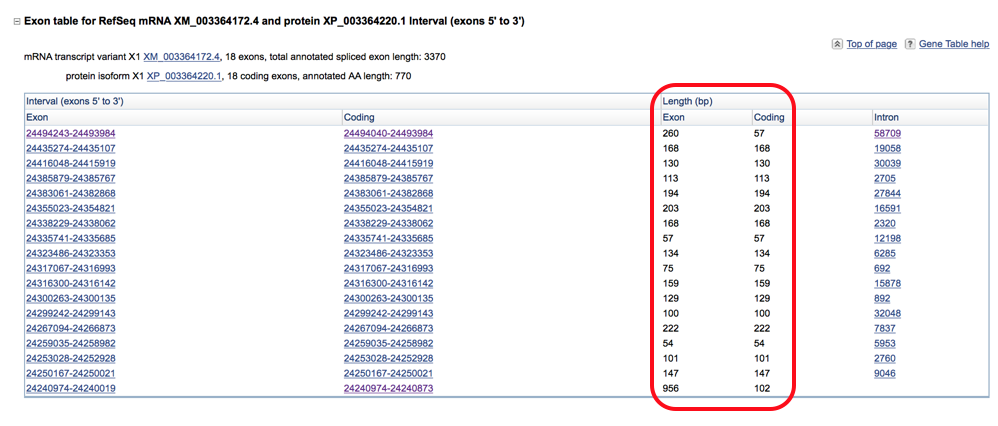
- Is there a 5’ UTR and 3’ UTR?
- This can be assessed by looking at the difference between the exon & coding base pair lengths. The 5’ and 3’ UTR would be included in the exon length but not in the coding length which helps determine if they are present at the start and end of the transcription. If the exon length and coding length are the same for the first exon that would indicate there is no 5’ UTR. The 5’ UTR is more commonly missing than the 3’ and that is due to it being a very GC rich region and harder to translate.
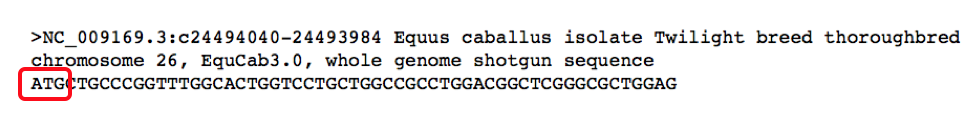
- Is there a start codon (ATG)?
- The start codon should be the first three base pairs (ATG) of the first coding exon. Select the first coding exon sequence from the second column to check for the start codon. There may be times where the start codon is not located on exon 1 and might be located on exon 2 or 3 and this is because the 5’ UTR has spanned more than one exon.
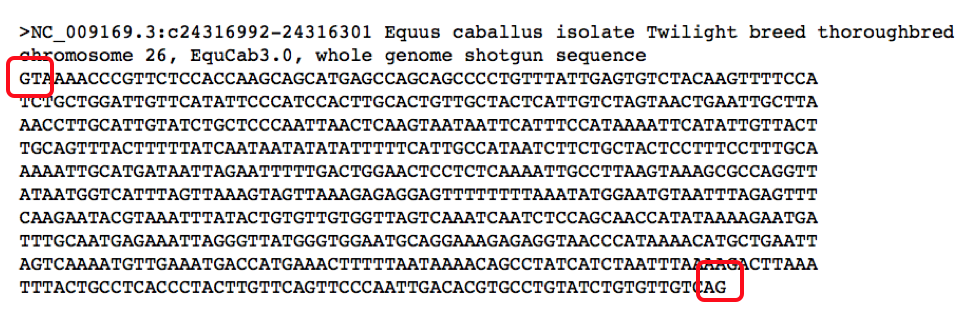
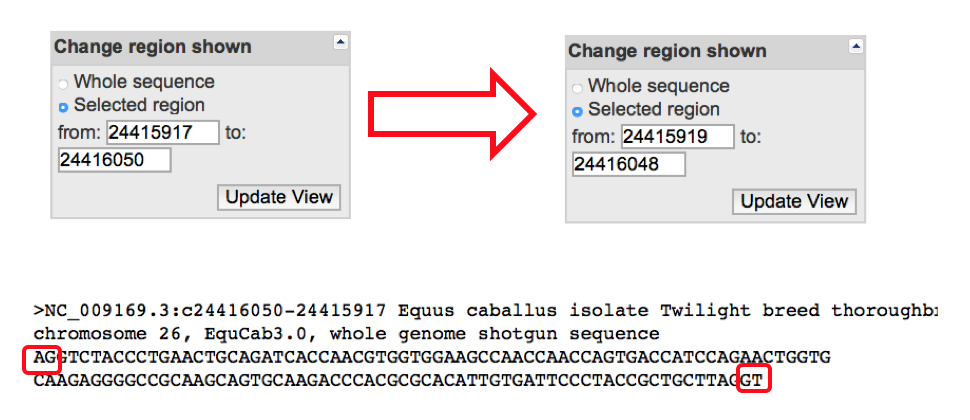
- Are the splice junctions appropriate? These correspond to the regions where the introns are removed (“spliced”) to form the coding sequence. All of the intron regions should start with “GT” and end with “AG”. You can assess this in two ways:
- First you can select the intron sequences from column 5 of the transcript table and view the start and end of the sequence.
- OR you can select the coding sequences and extend the base pair length by two both upstream and downstream to include the end and start of the adjacent introns. When doing it this way the first two letters on the sequence should be the ending “AG” of the preceding intron and the last two should be the starting “GT” of the next intron.
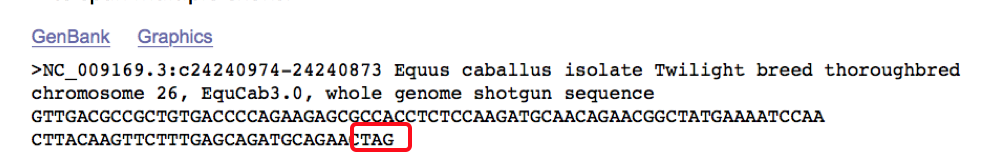
- Does it contain a stop codon (TAG, TAA, TGA) prior to the start of the 3’ untranslated region? This can be determined by looking at the coding sequence of the last coding exon in column two. The exon length and coding lengths should differ for this exon as it should also contain the 3’ UTR. Just as was the case with the 5’ UTR, the 3’ UTR is able to span multiple exons.
- Are there n’s in the sequence?
Once you have answered the above questions it is time to closer assess exons via BLAST. Below is a description on how to do this process of comparing coding sequences. Please also see the associated flowchart and tutorials on how to deal with common problems that may be encountered as you work through comparing human & horse genomes.
USING BLAST
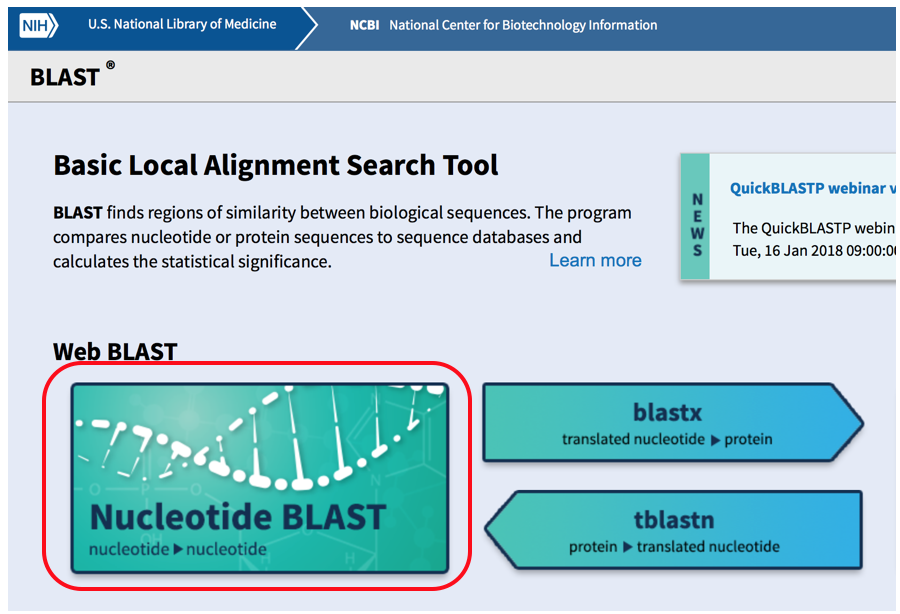
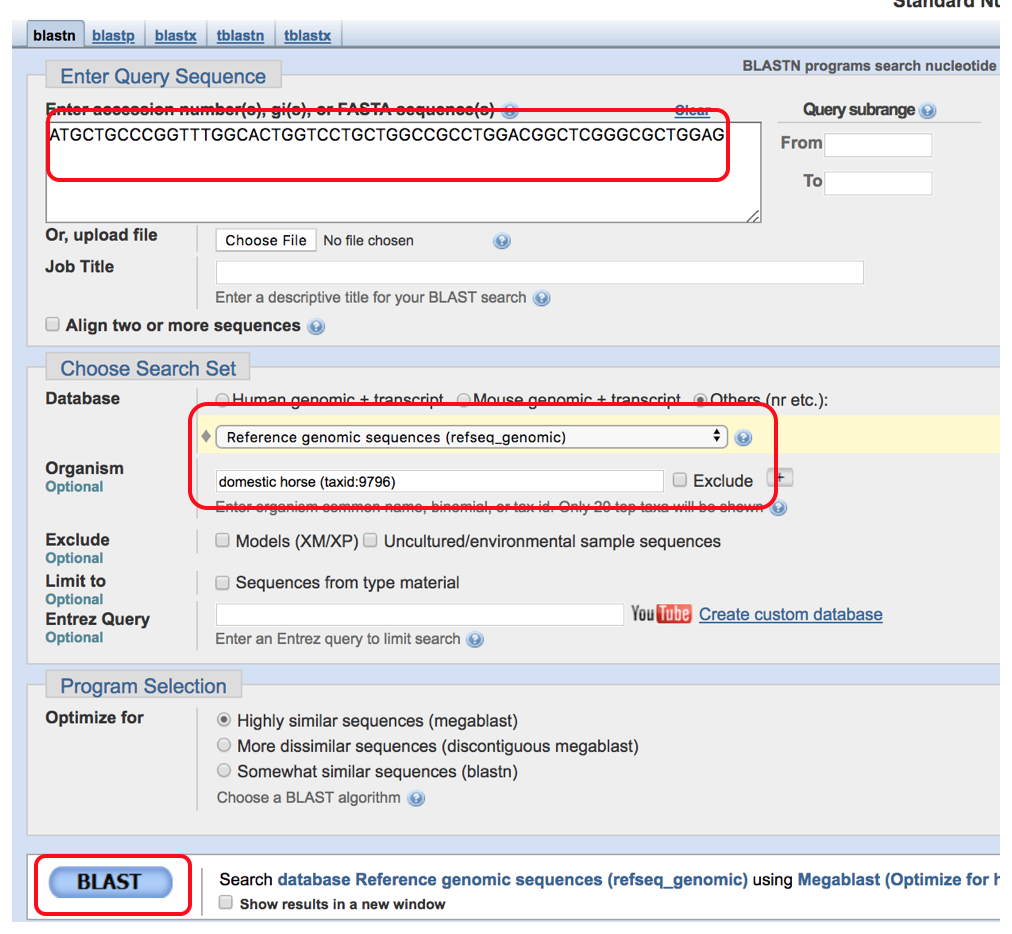
- Start by opening the BLAST browser at NCBI and selecting nucleotide BLAST
- Once you are in the nucleotide BLAST screen you will enter the human nucleotide sequence in the white box at the top of the page, select reference genome sequences (refseq.genomic) under databases and search the horse genome (taxid:9796) for a match. Select BLAST to match the sequences.
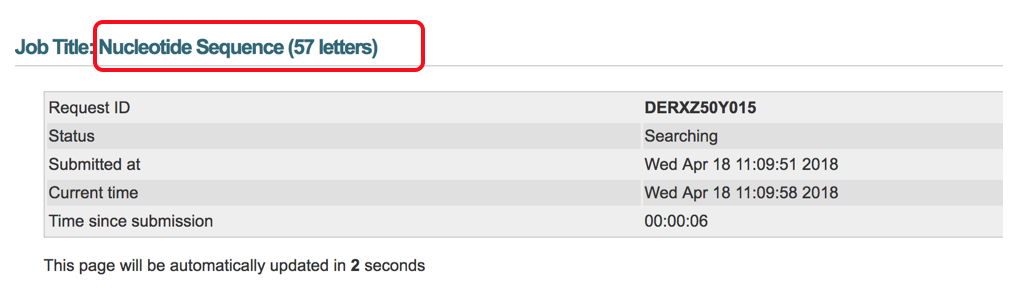
The screen will update multiple times as the BLAST is being performed and then results will be shown on screen. The processing screen highlights the number of base pairs included in the BLAST.
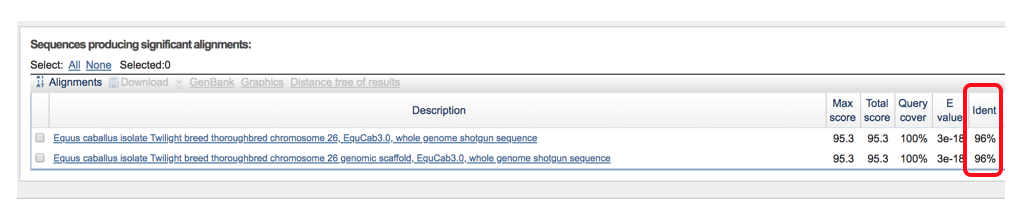
- Results will include the “Descriptions” (shown below) that show all of the separate transcript alignments and the identity match % (96%).
-
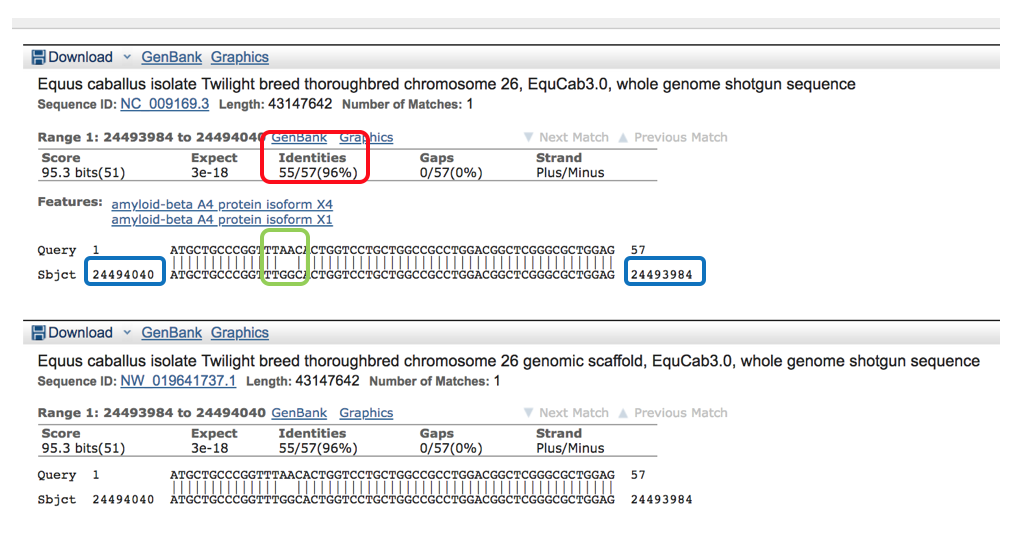
Below the descriptions section is the “Alignments” section which provides the individual transcript matches. The identities column shows how many of the nucleotides matchup between the horse & human (in this example: 55/57 or 96%, shown in red box). The “query” sequence is the human sequence that was entered into BLAST and the “subject” is the equine reference sequence.
-
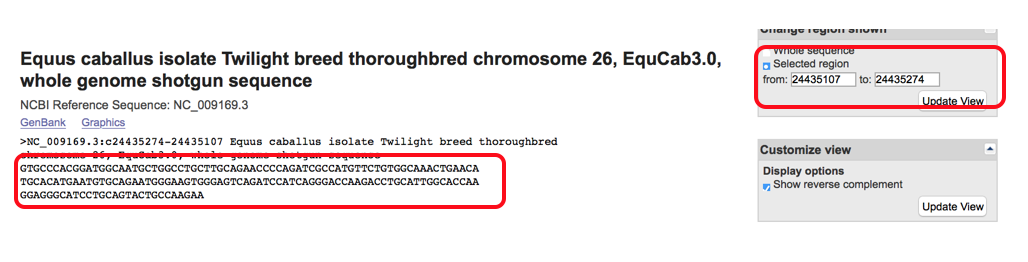
On the left and right side of the subject sequence is the base pair position of this sequence. (For example this sequence spans between the base pair positions of 24,494,040 and 24,493,984- shown in the blue boxes).
-
Any difference in nucleotides is visualized at the individual level shown with the absence of a vertical line joining the two differing base pairs shown within the green box below.
-
MULTIPLE SPECIES ALIGNMENT
Another component of comparing genomes is to do a multiple species alignment that looks at a gene sequence (either as nucleotides or as amino acids) across many species. This allows us to compare the species of interest to others and look at whether or not variants that are occurring are present in conserved or non-conserved regions of the gene. A conserved region is one in which the sequence is very similar to identical in multiple species which could indicate that this region is important for function. Non-conserved regions can vary greatly between species which often indicates that they are not as important for general functions, and variants identified in non-conserved regions are often not as significant.
There are a variety of programs available online that can perform multiple species alignment. For this example we will use a free program called Multiple sequence alignment by Florence Corpet that can be found at the MultAlin Website
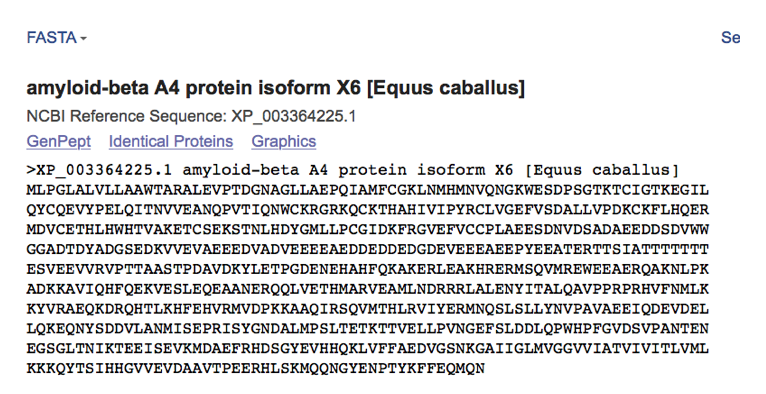
In order to perform multiple alignment you need to pull the FASTA sequence from the desired species you want to compare as described below and insert it into the MultAlin website.
- Start by locating the desired gene (ex: APP horse) and opening the gene table screen that shows the exon transcripts. Select the name of the mRNA transcript variant which is listed in the description of that transcript (shown below) which will then open another screen where you have the option of selecting the FASTA sequence.
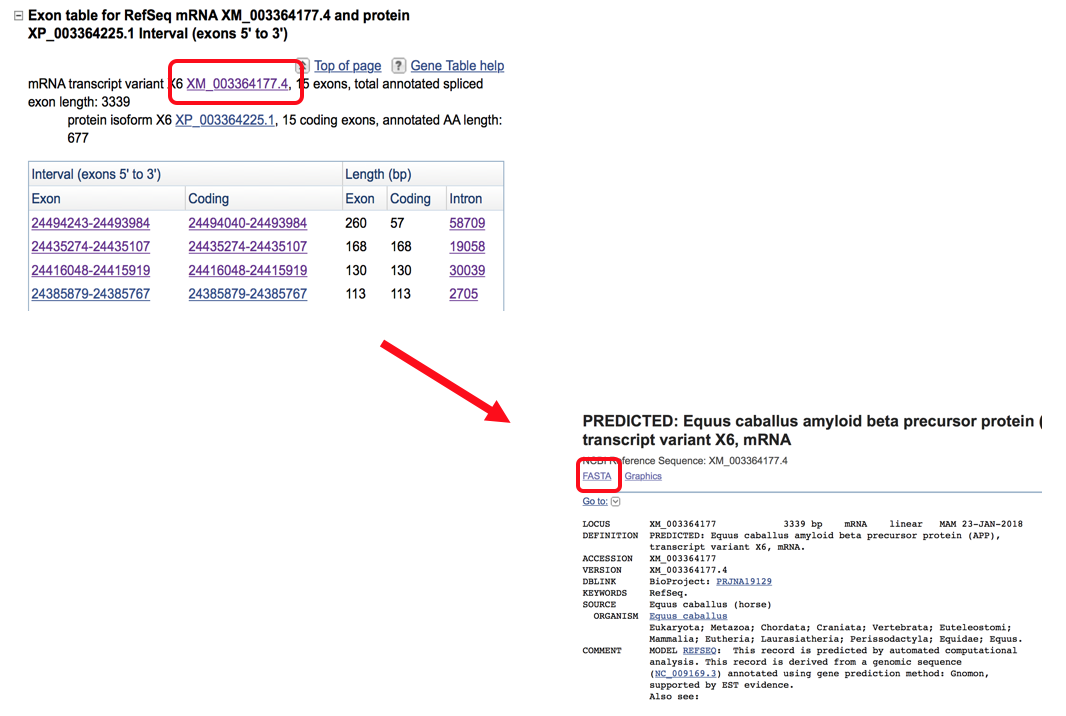
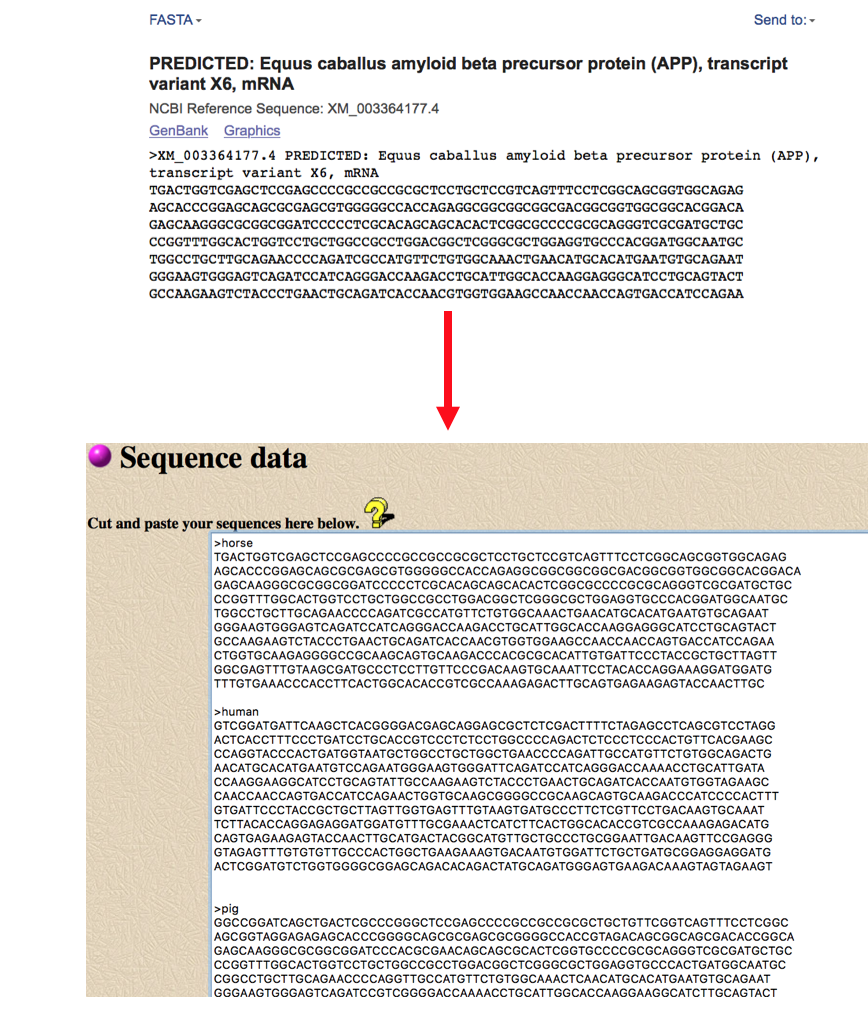
- Selecting FASTA will open the nucleotide sequence for the entire gene. This entire sequence is then copy and pasted into the MultAlin sequence box. Each individual sequence that is put into the MultAlin search box needs to be led with a >Species (ex: >horse) as this will give a title to the sequence so you can identify which sequence is from which animal.
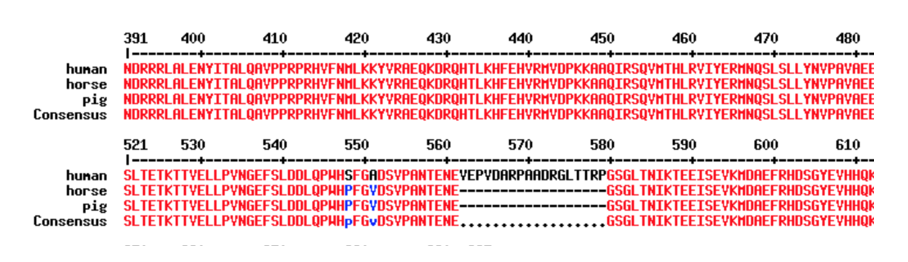
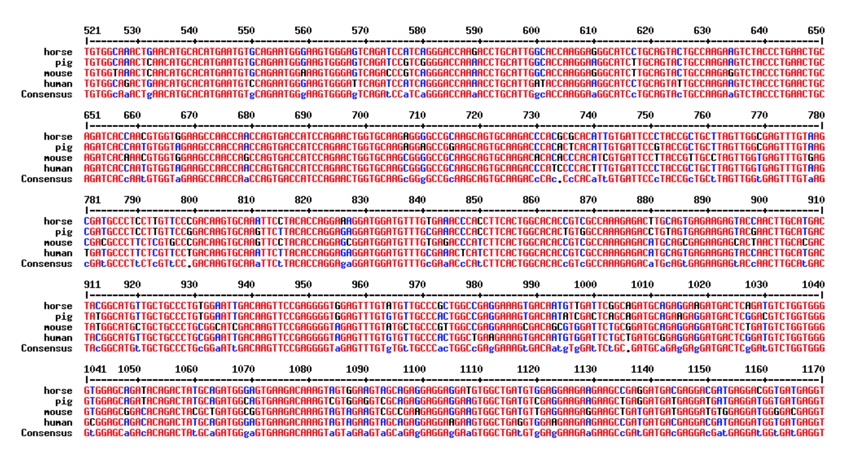
- Results will look like the image below. The computer program creates a row for each animal transcript with the title you created by putting the name after the “>” sign. This allows you to look at the nucleotide conservation across all of the species you entered. Everything shown in red is an area that matches across all species. An area in which all the species do not agree is shown in blue with the differing nucleotide base pair or missing nucleotides shown in black.
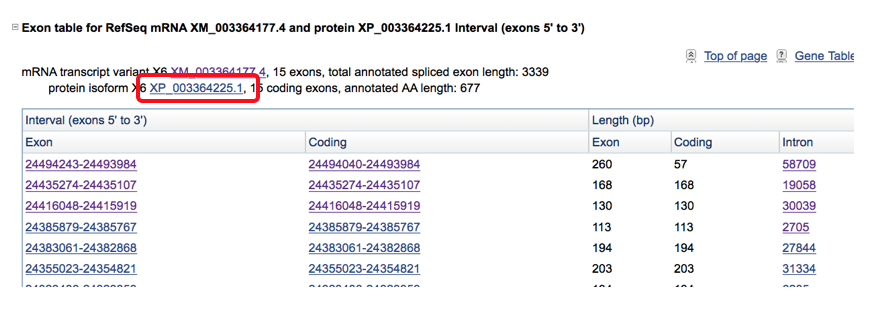
- This step is then often repeated to look at the amino acid conservation across species as nucleotide differences that affect the amino acid sequence are likely more significant and have the potential to cause greater effects. This is done by clicking on the protein isoform located in the transcript description and obtaining the FASTA sequence of amino acids.
- The FASTA amino acid sequence is then pasted into the sequence box for multiple species (same as shown above for amino acids) to generate a multiple species alignment that looks like the one shown below. Amino acids that are the same are shown in red with differing regions shown in blue and individual base pair differences/insertions/deletions shown in black.